

Europe has a sophisticated air-quality monitoring system — fixed monitors, reporting networks and increasingly detailed models — that matters for law, health protection and public debate. The harder public-health question is how well ambient readings and modelled estimates stand in for the pollution people encounter where they live, walk, work and sleep. Those are related questions, not the same one. Confusing a station concentration with how far it can reasonably apply across space, or either of those with personal exposure, is how sophisticated numbers can still mislead policy and epidemiology.Η Ευρώπη διαθέτει ένα εξελιγμένο σύστημα παρακολούθησης της ποιότητας του αέρα — σταθεροί σταθμοί, δίκτυα αναφοράς και ολοένα λεπτομερέστερα μοντέλα — που έχει σημασία για τη νομοθεσία, την προστασία της υγείας και τη δημόσια συζήτηση. Το δυσκολότερο ερώτημα δημόσιας υγείας είναι πόσο καλά οι μετρήσεις περιβάλλοντος και οι εκτιμήσεις των μοντέλων αντιστοιχούν στη ρύπανση που συναντούν οι άνθρωποι εκεί όπου ζουν, περπατούν, εργάζονται και κοιμούνται. Πρόκειται για συναφή ερωτήματα, όχι για το ίδιο. Όταν συγχέεται η συγκέντρωση σε έναν σταθμό με το πόσο μακριά μπορεί εύλογα να ισχύει στον χώρο — ή οποιοδήποτε από τα δύο με την ατομική έκθεση — ακόμη και εξελιγμένοι αριθμοί μπορούν να παραπλανήσουν την πολιτική και την επιδημιολογία.
Key takeawaysΒασικά συμπεράσματα
- Monitoring stations measure ambient concentrations for defined purposes — including, for background sites, representing broader population exposure. Spatial representativeness asks how far those measurements can reasonably apply; personal exposure asks what individuals actually encounter across places, time, indoors and mobility. Mixing those layers overstates what one station proves about lived air.Οι σταθμοί παρακολούθησης μετρούν συγκεντρώσεις περιβάλλοντος για καθορισμένους σκοπούς — συμπεριλαμβανομένης, στους σταθμούς υποβάθρου, της αντιπροσώπευσης ευρύτερης έκθεσης του πληθυσμού. Η χωρική αντιπροσωπευτικότητα ρωτά πόσο μακριά μπορούν εύλογα να ισχύουν αυτές οι μετρήσεις· η ατομική έκθεση ρωτά τι συναντούν πραγματικά οι άνθρωποι σε τόπους, χρόνους, εσωτερικούς χώρους και μετακινήσεις. Αν αναμειχθούν αυτά τα επίπεδα, υπερεκτιμάται τι αποδεικνύει ένας σταθμός για τον αέρα της καθημερινότητας.
- EEA’s 2026 status report still finds up to 20% of stations above current EU standards for some pollutants, while more than nine in ten Europeans remain above WHO guideline levels — two different yardsticks, both important.Η έκθεση κατάστασης του ΕΟΠ για το 2026 εξακολουθεί να εντοπίζει έως και το 20% των σταθμών πάνω από τα ισχύοντα πρότυπα της ΕΕ για ορισμένους ρύπους, ενώ περισσότεροι από εννέα στους δέκα Ευρωπαίους παραμένουν πάνω από τα επίπεδα των κατευθυντήριων γραμμών του ΠΟΥ — δύο διαφορετικά μέτρα σύγκρισης, και τα δύο σημαντικά.
- Directive (EU) 2024/2881 and Implementing Decision (EU) 2026/1208 push modelling and spatial representativeness assessment deeper into the legal framework — necessary measurement reform, not by itself cleaner air.Η Οδηγία (ΕΕ) 2024/2881 και η Εκτελεστική Απόφαση (ΕΕ) 2026/1208 εντάσσουν βαθύτερα τη μοντελοποίηση και την αξιολόγηση χωρικής αντιπροσωπευτικότητας στο νομικό πλαίσιο — αναγκαία μεταρρύθμιση στον τρόπο μέτρησης, όχι από μόνη της καθαρότερος αέρας.
- Exposure misclassification can blunt epidemiology and hide inequities when hotspots and mobility patterns sit far from “average” background sites.Η εσφαλμένη ταξινόμηση της έκθεσης μπορεί να αποδυναμώσει τις επιδημιολογικές εκτιμήσεις και να αποκρύψει ανισότητες, όταν τα θερμά σημεία και τα πρότυπα μετακίνησης απέχουν πολύ από τους «μέσους» σταθμούς υποβάθρου.
What official networks actually measureΤι μετρούν πραγματικά τα επίσημα δίκτυα
Official networks measure ambient outdoor concentrations at designated sites — not a personal dose, and not automatically the air on every street. The European Environment Agency (EEA) classifies monitoring stations by purpose. Background stations, in EEA’s wording, are intended to represent pollution levels characteristic of the average exposure of the general population. Traffic and industrial sites serve other purposes: capturing local source influence rather than pretending to be everyone’s day.Τα επίσημα δίκτυα μετρούν συγκεντρώσεις περιβάλλοντος σε εξωτερικό χώρο, σε καθορισμένες θέσεις — όχι ατομική δόση, και όχι αυτόματα τον αέρα σε κάθε δρόμο. Ο Ευρωπαϊκός Οργανισμός Περιβάλλοντος (ΕΟΠ) ταξινομεί τους σταθμούς παρακολούθησης ανάλογα με τον σκοπό τους. Οι σταθμοί υποβάθρου, με τη διατύπωση του ΕΟΠ, προορίζονται να αντιπροσωπεύουν επίπεδα ρύπανσης χαρακτηριστικά της μέσης έκθεσης του γενικού πληθυσμού. Οι σταθμοί κυκλοφορίας και βιομηχανίας εξυπηρετούν άλλους σκοπούς: να αποτυπώνουν την τοπική επίδραση πηγών, χωρίς να ισχυρίζονται ότι περιγράφουν την ημέρα όλων.
That design intent is useful and easy to over-read. A well-placed background station can be an excellent tool for tracking trends and checking compliance with limit values. It is not a miniature of every neighbourhood. When public conversation treats “the city’s reading” as if it were a personal meter on every resident, the network is asked to answer a question it was never built to settle alone.Αυτή η πρόθεση σχεδιασμού είναι χρήσιμη — και εύκολο να υπερερμηνευθεί. Ένας καλά τοποθετημένος σταθμός υποβάθρου μπορεί να είναι εξαιρετικό εργαλείο για την παρακολούθηση τάσεων και τον έλεγχο συμμόρφωσης με οριακές τιμές. Δεν αποτελεί μικρογραφία κάθε γειτονιάς. Όταν η δημόσια συζήτηση αντιμετωπίζει «την ένδειξη της πόλης» σαν προσωπικό μετρητή για κάθε κάτοικο, το δίκτυο καλείται να απαντήσει σε ερώτημα που δεν σχεδιάστηκε να λύσει μόνο του.
None of this is an argument against fixed networks. Without comparable, quality-assured ambient series, Europe would lose the ability to show whether limit values are met, whether trends are real, and whether Member States are converging. The public-health mistake is narrower: treating a compliance instrument as if it already answered the exposure question in full. Those jobs can share infrastructure. They still need different sentences in reports and in headlines.Τίποτε από αυτά δεν αποτελεί επιχείρημα κατά των σταθερών δικτύων. Χωρίς συγκρίσιμες, ποιοτικά διασφαλισμένες χρονοσειρές περιβάλλοντος, η Ευρώπη θα έχανε τη δυνατότητα να δείξει αν τηρούνται οι οριακές τιμές, αν οι τάσεις είναι πραγματικές και αν τα κράτη μέλη συγκλίνουν. Το λάθος δημόσιας υγείας είναι στενότερο: να αντιμετωπίζεται ένα όργανο συμμόρφωσης σαν να έχει ήδη απαντήσει πλήρως στο ερώτημα της έκθεσης. Οι δύο αυτές εργασίες μπορούν να μοιράζονται υποδομή. Χρειάζονται, ωστόσο, διαφορετικές διατυπώσεις στις εκθέσεις και στους τίτλους.
EEA’s Air quality status in Europe 2026 report underlines both progress and unfinished business. Air quality continues to improve, yet in up to 20% of monitoring stations across the reporting network pollution remains above current EU air-quality standards — especially for PM10, ground-level ozone (O3) and benzo(a)pyrene (BaP). That is a station-level finding about legal standards still in force, not a claim that monitors systematically underestimate what people breathe.Η έκθεση του ΕΟΠ Air quality status in Europe 2026 υπογραμμίζει τόσο την πρόοδο όσο και όσα μένουν ακόμη ανοιχτά. Η ποιότητα του αέρα συνεχίζει να βελτιώνεται, όμως σε έως και το 20% των σταθμών παρακολούθησης στο δίκτυο αναφοράς η ρύπανση παραμένει πάνω από τα ισχύοντα πρότυπα ποιότητας αέρα της ΕΕ — ιδίως για PM10, τροποσφαιρικό όζον (O3) και βενζο(α)πυρένιο (BaP). Πρόκειται για εύρημα σε επίπεδο σταθμών για τα νομικά πρότυπα που ισχύουν ακόμη — όχι για ισχυρισμό ότι οι σταθμοί υποεκτιμούν συστηματικά όσα εισπνέουν οι άνθρωποι.
Up to 20 percent of monitoring stations in Europe still record air pollution above current EU air quality standards, especially for PM10, ozone and benzo(a)pyrene. Έως και το 20% των σταθμών παρακολούθησης στην Ευρώπη εξακολουθεί να καταγράφει ατμοσφαιρική ρύπανση πάνω από τα ισχύοντα πρότυπα της ΕΕ, ιδίως για PM10, όζον και βενζο(α)πυρένιο.
of monitoring stations still above current EU standards (esp. PM10, O3, BaP)των σταθμών παρακολούθησης ακόμη πάνω από τα ισχύοντα πρότυπα της ΕΕ (ιδίως PM10, O3, BaP)
Source: EEA, Air quality status in Europe 2026 (key messages). Πηγή: ΕΟΠ, Air quality status in Europe 2026 (βασικά μηνύματα).
Against the World Health Organization’s 2021 Global Air Quality Guidelines, the picture is stricter. EEA reports that for most pollutants concentrations remain well above WHO guideline levels, with more than nine out of ten Europeans exposed above those levels. The same report’s PM2.5 chapter for 2024 shows how yardsticks diverge at station level: 92.5% of PM2.5 reporting stations were above the WHO annual guideline (5 µg/m³), about 1% (23 stations) were above the current EU annual limit value (25 µg/m³), and 60.7% were already below the 2030 EU annual limit (10 µg/m³). Passing today’s EU limit is not the same as meeting a health-based guideline — and neither figure is a personal exposure diary.Σε σύγκριση με τις Παγκόσμιες Κατευθυντήριες Γραμμές για την Ποιότητα του Αέρα του Παγκόσμιου Οργανισμού Υγείας (ΠΟΥ) του 2021, η εικόνα είναι αυστηρότερη. Ο ΕΟΠ αναφέρει ότι για τους περισσότερους ρύπους οι συγκεντρώσεις παραμένουν αισθητά πάνω από τα επίπεδα των κατευθυντήριων γραμμών του ΠΟΥ, με περισσότερους από εννέα στους δέκα Ευρωπαίους εκτεθειμένους πάνω από αυτά τα επίπεδα. Το κεφάλαιο της ίδιας έκθεσης για τα PM2.5 το 2024 δείχνει πόσο αποκλίνουν τα μέτρα σύγκρισης σε επίπεδο σταθμών: το 92,5% των σταθμών αναφοράς PM2.5 ήταν πάνω από την ετήσια κατευθυντήρια γραμμή του ΠΟΥ (5 µg/m³), περίπου το 1% (23 σταθμοί) πάνω από την ισχύουσα ετήσια οριακή τιμή της ΕΕ (25 µg/m³), και το 60,7% ήδη κάτω από την ετήσια οριακή τιμή της ΕΕ για το 2030 (10 µg/m³). Η τήρηση του σημερινού ορίου της ΕΕ δεν ταυτίζεται με την επίτευξη κατευθυντήριας γραμμής με βάση την υγεία — και κανένας από τους δύο αριθμούς δεν αποτελεί ημερολόγιο ατομικής έκθεσης.
WHO annual air quality guideline 5 micrograms per cubic metre; EU 2030 annual limit value 10; current EU annual limit value 25. Bars scaled relative to 25 as 100 percent. Ετήσια κατευθυντήρια γραμμή ΠΟΥ 5 μικρογραμμάρια ανά κυβικό μέτρο· ετήσια οριακή τιμή ΕΕ 2030 ίση με 10· ισχύουσα ετήσια οριακή τιμή ΕΕ ίση με 25. Οι στήλες κλιμακώνονται με βάση το 25 ως 100%.
Source: WHO Global Air Quality Guidelines 2021; Directive (EU) 2024/2881 / EEA PM2.5 standards table. Values are legal or guideline thresholds, not observed station concentrations. Πηγή: Παγκόσμιες Κατευθυντήριες Γραμμές ΠΟΥ για την Ποιότητα του Αέρα 2021· Οδηγία (ΕΕ) 2024/2881 / πίνακας προτύπων ΕΟΠ για PM2.5. Οι τιμές είναι νομικά ή κατευθυντήρια όρια, όχι παρατηρούμενες συγκεντρώσεις σταθμών.
Spatial representativeness and hotspotsΧωρική αντιπροσωπευτικότητα και θερμά σημεία
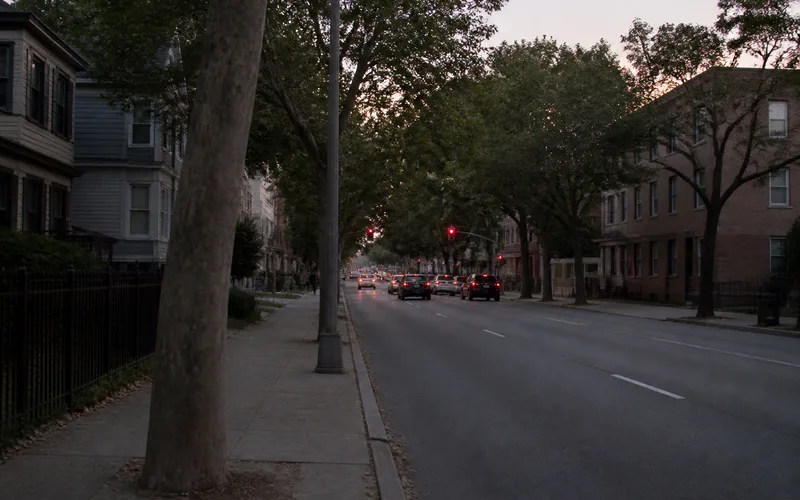
A monitoring station measures pollution at a specific location. That reading is essential — but it does not, by itself, describe every street nearby. Spatial representativeness asks a practical follow-up: over what area can that value reasonably be used? The question matters because pollution can change sharply over short distances, especially along traffic corridors and in narrow streets lined with tall buildings, where local peaks sit close to quieter pockets the nearest station may never “see.”Ένας σταθμός παρακολούθησης μετρά τη ρύπανση σε συγκεκριμένο σημείο. Η ένδειξη αυτή είναι απαραίτητη — αλλά από μόνη της δεν περιγράφει κάθε γειτονικό δρόμο. Η χωρική αντιπροσωπευτικότητα θέτει το πρακτικό επόμενο ερώτημα: σε ποια έκταση μπορεί εύλογα να χρησιμοποιηθεί αυτή η τιμή; Το ερώτημα μετράει, γιατί η ρύπανση μπορεί να αλλάζει απότομα σε μικρές αποστάσεις — ιδίως κατά μήκος διαδρόμων κυκλοφορίας και σε στενούς δρόμους με ψηλά κτίρια, όπου τοπικές κορυφές βρίσκονται δίπλα σε πιο ήσυχες γωνιές που ο πλησιέστερος σταθμός μπορεί να μην «βλέπει» ποτέ.
This is where modelling sits alongside fixed monitoring. Models help estimate what happens between monitoring points and across the city — filling the map that a sparse network cannot cover alone. FAIRMODE’s Working Group 4 guidance on microscale modelling emphasises high-resolution estimates at the height where people walk, and treats understanding local spatial variation — including how far a measured or modelled value can reasonably apply — as central to exposure-relevant assessment. Not every modelling approach captures those fine-scale urban patterns equally well; some smooth them away. Choosing tools suited to local gradients is therefore part of getting the spatial story right, not a detour into modelling theory for its own sake.Εδώ η μοντελοποίηση μπαίνει δίπλα στη σταθερή παρακολούθηση. Τα μοντέλα βοηθούν να εκτιμηθεί τι συμβαίνει ανάμεσα στα σημεία μέτρησης και σε όλη την πόλη — συμπληρώνοντας τον χάρτη που ένα αραιό δίκτυο δεν μπορεί να καλύψει μόνο του. Η καθοδήγηση της Ομάδας Εργασίας 4 του FAIRMODE για μοντελοποίηση σε μικρή κλίμακα δίνει έμφαση σε εκτιμήσεις υψηλής ανάλυσης στο ύψος όπου περπατούν οι άνθρωποι και αντιμετωπίζει την κατανόηση της τοπικής χωρικής διακύμανσης — συμπεριλαμβανομένου του πόσο μακριά μπορεί εύλογα να ισχύει μια μετρημένη ή μοντελοποιημένη τιμή — ως κεντρικό στοιχείο της εκτίμησης έκθεσης. Δεν αποτυπώνουν όλες οι προσεγγίσεις μοντελοποίησης εξίσου καλά αυτά τα λεπτομερή αστικά μοτίβα· ορισμένες τα εξομαλύνουν. Η επιλογή εργαλείων κατάλληλων για τις τοπικές διαβαθμίσεις ανήκει λοιπόν στη σωστή χωρική αφήγηση — όχι σε μια παρέκβαση στη θεωρία των μοντέλων για τη θεωρία.
For public health, the pay-off is practical. Better spatial information can reveal hotspots and corridors where concentrations — and often the people living closest to traffic — diverge from city averages, and can help target interventions where they are most needed. It improves the step from an ambient reading toward a more credible picture of population exposure. It does not invent pollution, and it does not mean that official monitoring stations are “wrong” when a peak sits metres away from a site designed for a different purpose. Nor does a sharper map, by itself, clean the air: measurement and modelling refine what we know; emissions, traffic and heating choices still decide what people breathe.Για τη δημόσια υγεία, το όφελος είναι πρακτικό. Καλύτερη χωρική πληροφορία μπορεί να αποκαλύψει θερμά σημεία και διαδρόμους όπου οι συγκεντρώσεις — και συχνά οι άνθρωποι που ζουν πιο κοντά στην κυκλοφορία — αποκλίνουν από τους μέσους όρους της πόλης, και να βοηθήσει να στοχευθούν παρεμβάσεις εκεί όπου χρειάζονται περισσότερο. Βελτιώνει το βήμα από μια ένδειξη περιβάλλοντος προς μια πιο αξιόπιστη εικόνα της έκθεσης του πληθυσμού. Δεν επινοεί τη ρύπανση, ούτε σημαίνει ότι οι επίσημοι σταθμοί είναι «λάθος» όταν μια κορυφή βρίσκεται μέτρα μακριά από θέση σχεδιασμένη για άλλον σκοπό. Ούτε ένας πιο ακριβής χάρτης, από μόνος του, καθαρίζει τον αέρα: η μέτρηση και η μοντελοποίηση βελτιώνουν όσα γνωρίζουμε· οι εκπομπές, η κυκλοφορία και οι επιλογές θέρμανσης εξακολουθούν να αποφασίζουν τι αναπνέουν οι άνθρωποι.
From ambient air to the air people breatheΑπό τον αέρα περιβάλλοντος στον αέρα που αναπνέουν οι άνθρωποι
Personal exposure is shaped by place, time, indoor environments and mobility. Even a spatially perfect outdoor map would not equal what one person inhales across a day spent partly indoors, on transit, or near a busy road for only an hour. Ambient concentration at a monitor or model cell is the first step; spatial representativeness asks how far that value can reasonably apply; population and personal exposure ask who is where, when, and in what micro-environment.Η ατομική έκθεση διαμορφώνεται από τον τόπο, τον χρόνο, τα εσωτερικά περιβάλλοντα και την κινητικότητα. Ακόμη και ένας χωρικά τέλειος υπαίθριος χάρτης δεν θα ταυτιζόταν με όσα εισπνέει ένας άνθρωπος στη διάρκεια μιας ημέρας που περνά εν μέρει σε εσωτερικούς χώρους, σε μέσα μεταφοράς ή κοντά σε πολυσύχναστο δρόμο μόνο για μία ώρα. Η συγκέντρωση περιβάλλοντος σε σταθμό ή σε σημείο του πλέγματος ενός μοντέλου είναι το πρώτο βήμα· η χωρική αντιπροσωπευτικότητα ρωτά πόσο μακριά μπορεί εύλογα να ισχύει αυτή η τιμή· η έκθεση πληθυσμού και η ατομική έκθεση ρωτούν ποιος βρίσκεται πού, πότε και σε ποιο μικροπεριβάλλον.
Conceptual three-step pathway: ambient concentration at a monitor or model cell; spatial representativeness of that value; population or personal exposure shaped by place, time, indoors and mobility. Εννοιολογική διαδρομή τριών βημάτων: συγκέντρωση περιβάλλοντος σε σταθμό ή σε σημείο του πλέγματος ενός μοντέλου· χωρική αντιπροσωπευτικότητα αυτής της τιμής· έκθεση πληθυσμού ή ατομική έκθεση που διαμορφώνεται από τόπο, χρόνο, εσωτερικούς χώρους και κινητικότητα.
- Ambient concentration at a monitor or model cellΣυγκέντρωση περιβάλλοντος σε σταθμό ή σε σημείο του πλέγματος ενός μοντέλου
- Spatial representativeness of that valueΧωρική αντιπροσωπευτικότητα αυτής της τιμής
- Population / personal exposure shaped by place, time, indoors and mobilityΈκθεση πληθυσμού / ατομική έκθεση που διαμορφώνεται από τόπο, χρόνο, εσωτερικούς χώρους και κινητικότητα
Conceptual framing for this article (informed by FAIRMODE WG4 microscale guidance). Not a statistical result. Εννοιολογικό πλαίσιο για το άρθρο (με αναφορά στην καθοδήγηση μικροκλίμακας FAIRMODE WG4). Δεν αποτελεί στατιστικό αποτέλεσμα.
Recent studies illustrate how large that last step can be — without licensing a blanket claim that fixed monitors always underestimate exposure. A 2025 Journal of Exposure Science & Environmental Epidemiology study of older adults in London (Wood and colleagues) found that personalised, time-activity-adjusted exposure estimates were substantially lower than residence-based ambient estimates. That is a directional finding in that cohort and setting: time spent indoors and away from the outdoor residence field can pull personal estimates down relative to a home outdoor assignment. It is not a universal rule for every city, pollutant or age group.Πρόσφατες μελέτες δείχνουν πόσο μεγάλο μπορεί να είναι αυτό το τελευταίο βήμα — χωρίς να δικαιολογούν έναν οριζόντιο ισχυρισμό ότι οι σταθεροί σταθμοί υποεκτιμούν πάντα την έκθεση. Μελέτη του 2025 στο Journal of Exposure Science & Environmental Epidemiology σε ηλικιωμένους στο Λονδίνο (Wood και συνεργάτες) βρήκε ότι οι εξατομικευμένες εκτιμήσεις έκθεσης με προσαρμογή στη χρονική δραστηριότητα ήταν ουσιαστικά χαμηλότερες από τις εκτιμήσεις περιβάλλοντος με βάση την κατοικία. Πρόκειται για κατευθυντικό εύρημα στη συγκεκριμένη κοόρτη και το συγκεκριμένο πλαίσιο: ο χρόνος σε εσωτερικούς χώρους και μακριά από το υπαίθριο πεδίο της κατοικίας μπορεί να «τραβήξει» προς τα κάτω τις ατομικές εκτιμήσεις σε σχέση με μια υπαίθρια απόδοση στην κατοικία. Δεν είναι καθολικός κανόνας για κάθε πόλη, ρύπο ή ηλικιακή ομάδα.
A 2026 npj Clean Air student panel in Guangzhou (n = 37 across three seasons) adds a pollutant-specific caution: the association between fixed-station and personal measurements was stronger for PM2.5 than for ozone. Small panels outside Europe cannot settle EU-wide policy, but they remind us that “how well does the network track personal air?” is not one answer for every pollutant.Πάνελ φοιτητών του 2026 στο npj Clean Air στην Guangzhou (n = 37 σε τρεις εποχές) προσθέτει μια προειδοποίηση ειδική ανά ρύπο: η συσχέτιση ανάμεσα στις μετρήσεις σταθερού σταθμού και στις ατομικές μετρήσεις ήταν ισχυρότερη για τα PM2.5 παρά για το όζον. Μικρά πάνελ εκτός Ευρώπης δεν μπορούν να κρίνουν την πολιτική της ΕΕ στο σύνολό της, υπενθυμίζουν όμως ότι το «πόσο καλά παρακολουθεί το δίκτυο τον ατομικό αέρα;» δεν έχει μία απάντηση για κάθε ρύπο.
AAQD 2024/2881 and Implementing Decision 2026/1208Οδηγία AAQD 2024/2881 και Εκτελεστική Απόφαση 2026/1208
Directive (EU) 2024/2881 — the revised Ambient Air Quality Directive — entered into force on 10 December 2024. It tightens the path toward 2030 standards, strengthens expectations around modelling and indicative measurements, and requires spatial representativeness information when modelling is used, with reassessment on a multi-year cycle. Article 10 also requires urban monitoring supersites at a density of at least one per 10 million inhabitants. These are institutional investments in how air is known and reported.Η Οδηγία (ΕΕ) 2024/2881 — η αναθεωρημένη Οδηγία για την ποιότητα του αέρα περιβάλλοντος — τέθηκε σε ισχύ στις 10 Δεκεμβρίου 2024. Θέτει αυστηρότερο πλαίσιο για την επίτευξη των προτύπων του 2030, ενισχύει τις απαιτήσεις για μοντελοποίηση και ενδεικτικές μετρήσεις και απαιτεί πληροφορίες χωρικής αντιπροσωπευτικότητας όταν χρησιμοποιείται μοντελοποίηση, με επανεξέταση σε πολυετή κύκλο. Το άρθρο 10 απαιτεί επίσης αστικούς υπερσταθμούς παρακολούθησης με πυκνότητα τουλάχιστον έναν ανά 10 εκατομμύρια κατοίκους. Πρόκειται για θεσμικές επενδύσεις στο πώς γνωρίζουμε και αναφέρουμε τον αέρα.
Commission Implementing Decision (EU) 2026/1208 of 9 June 2026 sets out detailed rules on modelling applications and spatial representativeness assessment. It applies from 30 June 2028. On spatial representativeness, the Decision applies a tolerance of 15% of the central value or a minimum tolerance in Annex I — whichever is greater — above and below that central value to define a concentration interval of “similar” locations. That is a methodological rule for how far a modelled or measured value may be treated as representative, not a promise of emission cuts.Η Εκτελεστική Απόφαση (ΕΕ) 2026/1208 της Επιτροπής, της 9ης Ιουνίου 2026, καθορίζει λεπτομερείς κανόνες για τις εφαρμογές μοντελοποίησης και την αξιολόγηση χωρικής αντιπροσωπευτικότητας. Εφαρμόζεται από τις 30 Ιουνίου 2028. Ως προς τη χωρική αντιπροσωπευτικότητα, η Απόφαση εφαρμόζει ανοχή ίση με το 15% της κεντρικής τιμής ή με την ελάχιστη ανοχή του Παραρτήματος I — όποια είναι μεγαλύτερη — πάνω και κάτω από την κεντρική τιμή, ώστε να οριστεί διάστημα συγκεντρώσεων «παρόμοιων» θέσεων. Πρόκειται για μεθοδολογικό κανόνα για το πόσο μακριά μια μοντελοποιημένη ή μετρημένη τιμή μπορεί να θεωρηθεί αντιπροσωπευτική, όχι για υπόσχεση μείωσης εκπομπών.
Read carefully, this regulatory turn is an admission that ambient numbers need an explicit spatial story attached to them. That is good measurement governance. It should not be mistaken for the separate work of reducing emissions, redesigning traffic, cleaner fuels for heating, or protecting the people who live in the noisiest chemical micro-environments. Better maps can make unfair air visible; they do not, by themselves, make it cleaner.Αν διαβαστεί προσεκτικά, αυτή η ρυθμιστική στροφή αποτελεί παραδοχή ότι οι αριθμοί περιβάλλοντος χρειάζονται δίπλα τους μια ρητή χωρική αφήγηση. Αυτό είναι καλή διακυβέρνηση της μέτρησης. Δεν πρέπει να συγχέεται με την ξεχωριστή δουλειά της μείωσης εκπομπών, του επανασχεδιασμού της κυκλοφορίας, των καθαρότερων καυσίμων θέρμανσης ή της προστασίας όσων ζουν στα πιο επιβαρυμένα χημικά μικροπεριβάλλοντα. Καλύτεροι χάρτες μπορούν να καταστήσουν ορατό τον άδικο αέρα· δεν τον καθιστούν, από μόνοι τους, καθαρότερο.
Why exposure misclassification matters for epidemiology and equityΓιατί η εσφαλμένη ταξινόμηση έκθεσης μετράει για την επιδημιολογία και τις ανισότητες στην έκθεση
Epidemiology that assigns the same outdoor concentration to everyone in a large area will misclassify people whose true exposure differs — upward or downward — from that assignment. Classical measurement-error thinking predicts attenuation of associations toward the null when error is largely random; when error is structured by neighbourhood, housing quality, commuting routes or occupational micro-environments, bias can also distort who appears most affected. Either way, the policy risk is real: under-powered or mis-located estimates of harm can weaken the case for targeted protection.Η επιδημιολογία που αποδίδει την ίδια υπαίθρια συγκέντρωση σε όλους μέσα σε μια μεγάλη περιοχή θα ταξινομήσει εσφαλμένα ανθρώπους των οποίων η πραγματική έκθεση διαφέρει — προς τα πάνω ή προς τα κάτω — από αυτή την απόδοση. Η κλασική σκέψη για σφάλμα μέτρησης προβλέπει εξασθένηση των συσχετίσεων προς το μηδέν όταν το σφάλμα είναι σε μεγάλο βαθμό τυχαίο· όταν το σφάλμα είναι δομημένο από τη γειτονιά, την ποιότητα κατοικίας, τις διαδρομές μετακίνησης ή τα επαγγελματικά μικροπεριβάλλοντα, η μεροληψία μπορεί επίσης να παραμορφώσει το ποιος φαίνεται περισσότερο επηρεασμένος. Και στις δύο περιπτώσεις, ο κίνδυνος για την πολιτική είναι πραγματικός: εκτιμήσεις βλάβης με ανεπαρκή στατιστική ισχύ ή λάθος τοποθέτηση μπορούν να αποδυναμώσουν την επιχειρηματολογία για στοχευμένη προστασία.
Equity enters because spatial and personal gaps are rarely randomly distributed. People living beside heavy traffic, working outdoors, or spending more time in poorly ventilated housing can sit systematically away from “average” background sites even when city-wide indicators look acceptable. Improving the fidelity of exposure assessment is therefore partly an equity tool: it reduces the chance that the most exposed become statistically invisible inside a smooth map. It is not, however, a substitute for the interventions those maps should then justify.Το ζήτημα της ισοτιμίας μπαίνει στο κάδρο επειδή τα χωρικά και ατομικά κενά σπάνια κατανέμονται τυχαία. Όσοι ζουν δίπλα σε βαριά κυκλοφορία, εργάζονται σε εξωτερικούς χώρους ή περνούν περισσότερο χρόνο σε κατοικίες με κακό αερισμό μπορεί να απέχουν συστηματικά από τους «μέσους» σταθμούς υποβάθρου ακόμη και όταν οι δείκτες σε επίπεδο πόλης φαίνονται αποδεκτοί. Η βελτίωση της πιστότητας στην εκτίμηση έκθεσης είναι επομένως εν μέρει εργαλείο ισότιμης προστασίας: μειώνει την πιθανότητα οι περισσότερο εκτεθειμένοι να γίνουν στατιστικά αόρατοι μέσα σε έναν ομαλό χάρτη. Δεν υποκαθιστά, ωστόσο, τις παρεμβάσεις που αυτοί οι χάρτες θα πρέπει στη συνέχεια να δικαιολογήσουν.
Better measurement is not the same as cleaner airΗ καλύτερη μέτρηση δεν ταυτίζεται με καθαρότερο αέρα
The central test this article applies is simple to state and easy to blur in practice: do we know ambient concentrations, or do we know what people breathe? Europe’s answer is increasingly sophisticated on the first half — stations, models, supersites, spatial representativeness rules under the revised Directive and Decision 2026/1208. That sophistication deserves credit. It also deserves boundaries. Monitoring accuracy and modelling fidelity are means. Population-health gains still depend on whether emissions fall, whether hotspots are treated as policy objects, and whether exposure assessment is honest about mobility, indoors and inequality.Η κεντρική δοκιμασία που εφαρμόζει αυτό το άρθρο διατυπώνεται απλά και θολώνει εύκολα στην πράξη: γνωρίζουμε τις συγκεντρώσεις περιβάλλοντος ή γνωρίζουμε τι αναπνέουν οι άνθρωποι; Η απάντηση της Ευρώπης γίνεται ολοένα πιο εξελιγμένη στο πρώτο μισό — σταθμοί, μοντέλα, υπερσταθμοί, κανόνες χωρικής αντιπροσωπευτικότητας στο πλαίσιο της αναθεωρημένης Οδηγίας και της Απόφασης 2026/1208. Αυτή η εξέλιξη αξίζει αναγνώριση. Χρειάζεται όμως και όρια. Η ακρίβεια παρακολούθησης και η πιστότητα μοντελοποίησης είναι μέσα. Τα οφέλη για την υγεία του πληθυσμού εξακολουθούν να εξαρτώνται από το αν μειώνονται οι εκπομπές, από το αν τα θερμά σημεία αντιμετωπίζονται ως αντικείμενα πολιτικής και από το αν η εκτίμηση έκθεσης είναι ειλικρινής ως προς την κινητικότητα, τους εσωτερικούς χώρους και τις ανισότητες.
I keep returning to the three-step chain: ambient value, spatial representativeness, lived exposure. When those steps stay distinct, official numbers remain powerful without pretending to be something they are not. When they collapse into one slogan about “the air we breathe,” public health loses precision exactly where precision would protect people. Better measurement is necessary. Cleaner air is a different achievement — and it is still the one that matters most.Επιστρέφω συνεχώς στην αλυσίδα των τριών βημάτων: τιμή περιβάλλοντος, χωρική αντιπροσωπευτικότητα, πραγματική έκθεση. Όταν αυτά τα βήματα μένουν διακριτά, οι επίσημοι αριθμοί παραμένουν ισχυροί χωρίς να προσποιούνται κάτι που δεν είναι. Όταν συμπτύσσονται σε ένα σύνθημα για «τον αέρα που αναπνέουμε», η δημόσια υγεία χάνει ακρίβεια ακριβώς εκεί όπου η ακρίβεια θα προστάτευε ανθρώπους. Η καλύτερη μέτρηση είναι αναγκαία. Ο καθαρότερος αέρας είναι διαφορετικό επίτευγμα — και παραμένει εκείνο που μετράει περισσότερο.
Sources & further readingΠηγές & περαιτέρω ανάγνωση
- EEA — Air quality status in Europe 2026ΕΟΠ — Κατάσταση ποιότητας του αέρα στην Ευρώπη 2026
- EEA — Particulate matter (PM2.5), Air quality status in Europe 2026ΕΟΠ — Αιωρούμενα σωματίδια (PM2.5), Κατάσταση ποιότητας του αέρα στην Ευρώπη 2026
- EEA — Monitoring station classifications and criteriaΕΟΠ — Ταξινομήσεις και κριτήρια σταθμών παρακολούθησης
- Directive (EU) 2024/2881 on ambient air quality and cleaner air for EuropeΟδηγία (ΕΕ) 2024/2881 για την ποιότητα του αέρα περιβάλλοντος και καθαρότερο αέρα για την Ευρώπη
- Commission Implementing Decision (EU) 2026/1208 on modelling applications and spatial representativenessΕκτελεστική Απόφαση (ΕΕ) 2026/1208 της Επιτροπής για εφαρμογές μοντελοποίησης και χωρική αντιπροσωπευτικότητα
- FAIRMODE WG4 — Best practice guidance for microscale air-quality modellingFAIRMODE WG4 — Καθοδήγηση βέλτιστης πρακτικής για μοντελοποίηση ποιότητας αέρα σε μικροκλίμακα
- WHO — WHO global air quality guidelines (2021)ΠΟΥ — Παγκόσμιες κατευθυντήριες γραμμές για την ποιότητα του αέρα (2021)
- Wood et al. — Personalised time-activity adjusted exposure estimates (JESEE, 2025)Wood και συν. — Εξατομικευμένες εκτιμήσεις έκθεσης με προσαρμογή στη χρονική δραστηριότητα (JESEE, 2025)
- npj Clean Air (2026) — Fixed-station versus personal exposure associations in a student panelnpj Clean Air (2026) — Συσχετίσεις σταθερού σταθμού και ατομικής έκθεσης σε πάνελ φοιτητών
Disclaimer: Content on this site provides general public health information for educational purposes only. It is not medical advice and does not replace consultation with a qualified healthcare professional.Αποποίηση ευθύνης: Το περιεχόμενο αυτού του ιστότοπου παρέχει γενικές πληροφορίες δημόσιας υγείας αποκλειστικά για εκπαιδευτικούς σκοπούς. Δεν αποτελεί ιατρική συμβουλή και δεν υποκαθιστά τη συμβουλή ειδικευμένου επαγγελματία υγείας.